
- The Bitcoin SV is currently trading at $34.30 while witnessing a -1.99% decline during the intraday session.
- Bitcoin SV price has been in the downward momentum forming lower lows since it made an annual high at $56.42.
- Year-to-date return of the BSV price is -13.86% and the three-month return is 4.88%.
After a frail start to the year 2023, the Bitcoin SV is now witnessing a downward momentum. In a year-to-date and six-month time frame, it has observed a decline of -13.86% and -19.96% respectively. This indicates the BSV price is dominated by bearish momentum in that time frame.
Since June 20, 2023, the Bitcoin SV price has observed a sudden spike in candles which lasted till July 1, 2023. In this time frame, it has witnessed a gain of roughly 130% from the lows of $24.70 to highs of $56.42, and also the past three-month return has changed in positive numerical value which is 4.88%.
The reason behind this bullish momentum was cooling inflation and the global macroeconomic situation. Due to several other optimistic factors such as the upcoming BRICS currency which could shake Dollar’s dominance and the inflation-tackling methods in the U.S., have boosted the sentiment, which results in a global crypto market capitalization of $1.19 Trillion.

Bitcoin SV on a Road to Frail
On the other hand, Bitcoin SV price has been in the downward momentum forming lower lows since it made an annual high at $56.42 resistance level, as the return of bears dominance in the market. If this current sentiment sustains in the market, there is a high probability the price will melt down to fill the lower wick of the previous candle, which resides near $34. If the price can reach the previous mark of $37.58, then, it can potentially retouch the previous $39.88 resistance level.
Technical Analysis
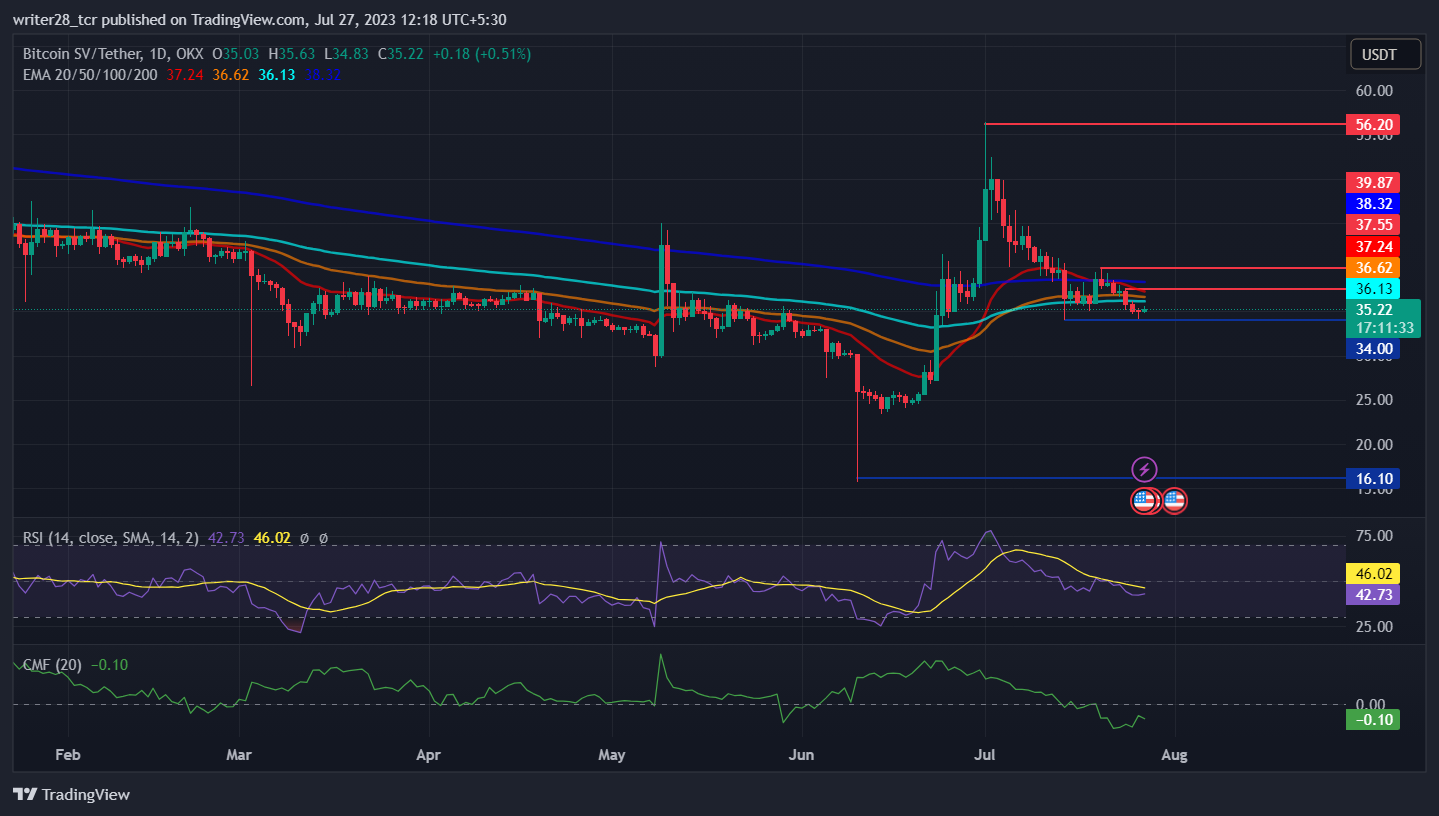
The Relative Strength Index (RSI) trades at 42.73 during the intraday session. RSI denotes the weakness in the market as the BSV price is depleting day by day.
The Chaikin Money Flow score is -0.10, as downward momentum sustains, and the rise in participation of sellers in the market remains, in the past 24 hours.
The Bitcoin SV price is currently trading below the 20, 50, 100 and 200-day EMA, indicating weakness in the market. Hence, there is downward momentum in the price for a long time.
The long and short ratio is 1.0004 with shorts at 49.99% and longs at 50.01%, representing the same pressure from the sellers and buyers of the market.
Conclusion
The market structure of the Bitcoin SV price represents the downward momentum since it achieved the annual high. From there, the price has witnessed the heavy involvement of bears in the market. Results in the weekly, monthly and yearly returns are negative. Investors should wait for their next move as the indicators present a different perspective for short-term investment.
Disclaimer
The views and opinions stated by the author, or any people named in this article, are for informational purposes only. They do not establish financial, investment, or other advice. Investing in or trading crypto assets comes with a risk of financial loss.