

- The stock has failed to breach its high of 1.80 twice this year.
- Heavy selling dragged the price to new lows of 1.27 dollars.
ARGO blockchain is a big name in crypto mining industry which promotes use of renewable sources of energy in the process of Mining. Their aim is to integrate global finance systems through sustainable sources of energy. The company headquarters are in London, UK, with operations in strategic locations of North America, and its shares are listed on the main market of the London Stock Exchange under the ticker: ARB and on NASDAQ Global Select Market in the United States under the ticker ARBK.
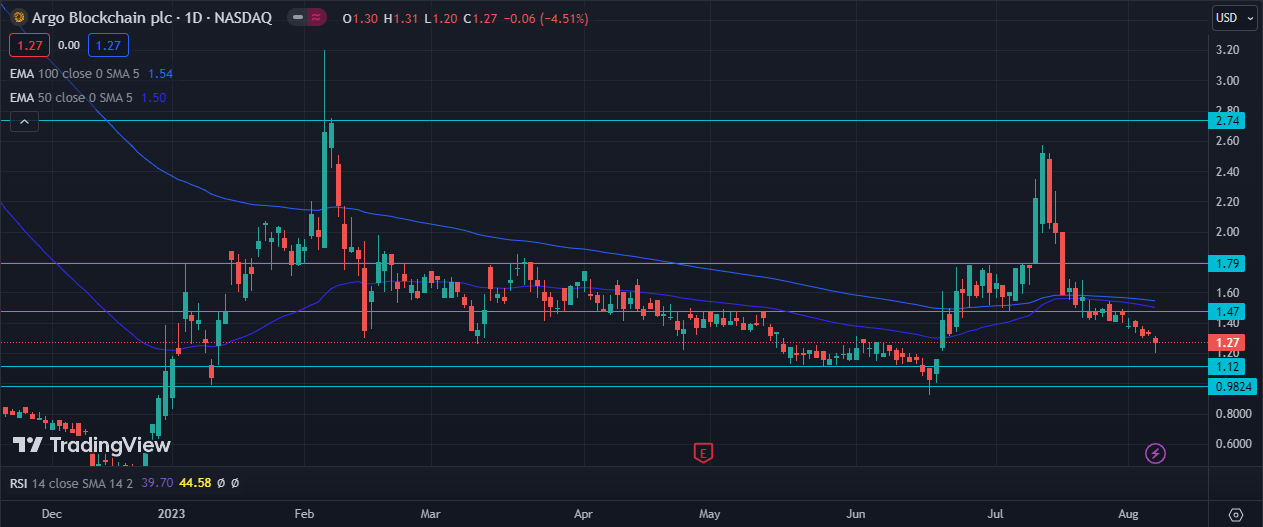
The stock has been highly stable historically. Volumes have usually remained low and this is one of the biggest reason for the stock to be still at such low prices. The stock created a high of 3.20 in February this year but since then there has been a sharp selling followed by a sideways movement up until June when the stock again shot up to $2.8 levels.
The stock broke its support at 1.47 in the previous week and has been falling since then continuously. Next support at 1.12 can be seen very shortly within a week if the downward movement continues.
As the price created its high of 2.8 last month, sellers take over the market. But, if this momentum continues and the price breaches 1.12 levels, one can expect more panic selling leading the stock to crash more. 1.47 is the next resistance in case of an upside in the stock.
A weak head and shoulder pattern was seen forming with a visible breakdown.

If one closely looks at the candles in the above chart picture, one will see a lot of gaps and unusually shaped candles. This is due to the poor volumes in the stock which makes it highly difficult to trade in. Buyers currently seem highly disinterested and even though the whole market is up, this stock is still soaring which is another big negative.
These kinds of stocks are more fundamentally based and move on the basis of news-related events more than they move based on technicals. A trader should stay away from such stocks as there can be no price predictions in these and also low volumes might result in a stuck position.
Conclusion:
Negative news related to the company’s earnings led to the stock falling sharply. Going by technical indicators, EMA and RSI predict more downside moves and so do most of the other indicators. $1.12 levels can be seen easily. 0.09 dollar levels might also emerge as predicted by the analysts. Both traders and investors are advised to stay away from the stock as it is highly unpredictable and can create a huge trap.
Major technical zones:
Major support levels- 1.12 dollars followed by .98 dollars.
Major resistance levels- 1.47 dollars followed by 1.79 dollars.
Current Market price- 1.27 dollars.