
- LEOCOIN CLOSED IN GREEN FOR THE STRAIGHT 6TH CONSECUTIVE DAY.
- LEOCOIN DECLINE 3.38 % IN A MONTH AND 22.17 % IN YEAR.
- LEOCOIN TRADING FLAT FROM SO LONG WITHOUT ANY VOLUME SURPRISE.
MARKET CAPITAL OF LEOCOIN – $ 3. 592 B
CURRENT MARKET PRICE – $ 3. 8572
LEOCOIN showed a massive rally on upside in Feb 2022 when the price surged 142% in just 11 days and made a high of $ 8.14 but since then the price is continuously falling down till Feb 2023 where the fall halted near the level $ 3. 31.
The downward trend was broken after MAY 2023 when the price breached the downward sloping trendline, along with it price crossed the swing high of lower low lower high structure in JUNE 2023 which confirmed that the downward trend is ending.
But if we look into the chart the price is trading flat but able to sustain on higher side of previous swing highs levels i.e $ 3.9 and $ 4.0 and above the previous lows $ 3.30 which is a good sign for the bulls that the market is trying to go upward and waiting for some necessary momentum on upside.
Leocoin dragged down 5% by the sellers on 3 september and the price formed a very strong bearish candle with a rise in volume which indicates that the sellers are present at upper levels i.e near $ 3.94.
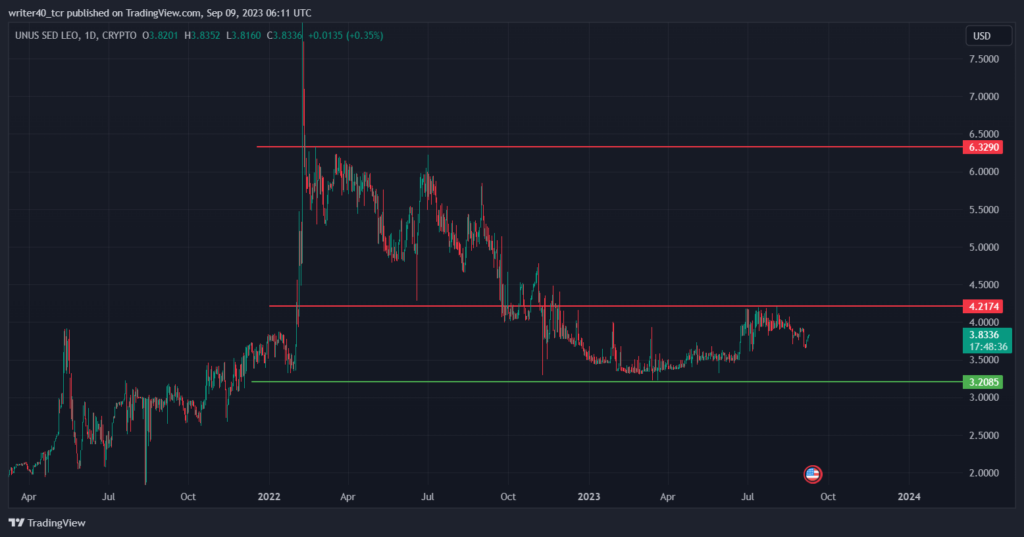
Leocoin price is currently facing a resistance near to the levels $ 4.217 and having a strong support near $ 3.20 and the price reacted positively from the support levels as price increased making a bullish candles formation i.e doji followed by green bullish candle and made a morning star kind of pattern on the support levels.
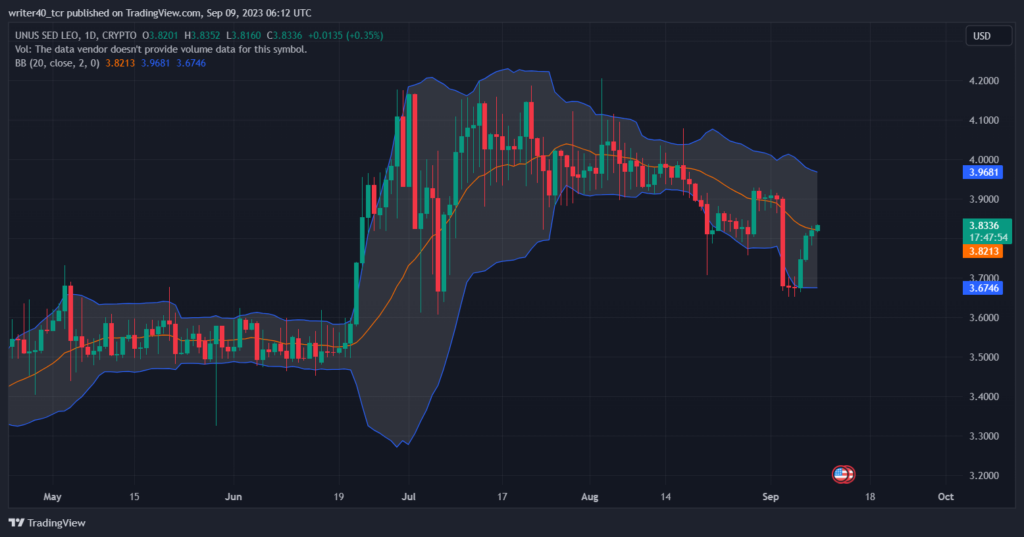
Leocoin went outside the bollinger band on 3rd september and entered again in the BB with a strong bullish candle and now trading above the median levels which is a positive sign for the price and now the price can face rejection near $ 3.96 i.e ( the upper level of bollinger bands ) .
WILL THE PRICE CONTINUE THE BULLISH MOMENTUM ?
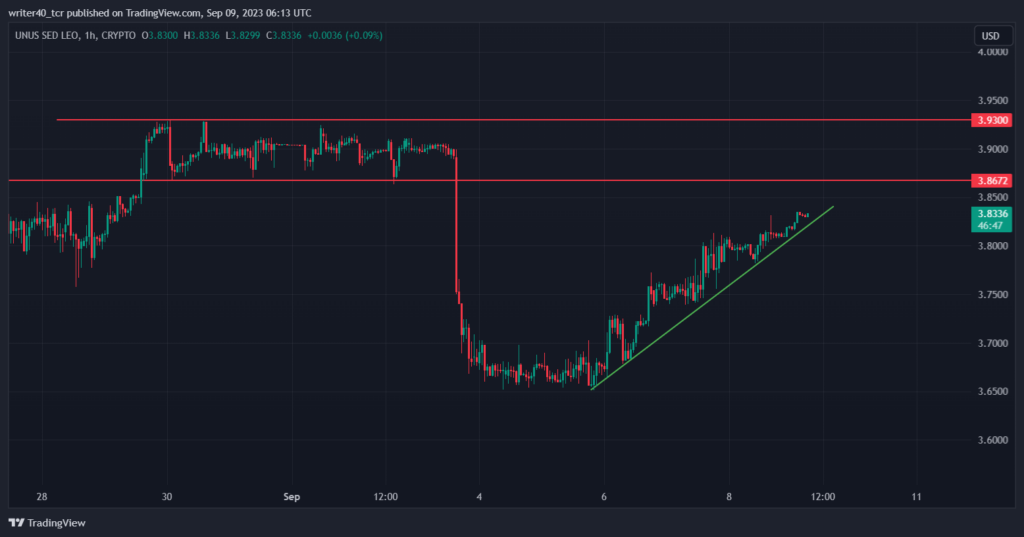
In the 1 hour time frame the price is looking super strong as of now as price is going up aggressively and the upward sloping trendline is supporting the price. Some spike in volumes has been seen when the price was forming a base between 3 sep to 5 sept which means the buyers created a positional trade in this counter and expected the price to go up .
Currently the resistance is present near to the levels $ 3. 86 and $ 3.93 which will restrict the price to go up and the strong demand area is between 3.69 and $ 3. 65.
CONCLUSION –
As the short term momentum is super strong so the price can try to breach the upper levels of $ 3.96 and $ 4.20 as the volumes are supporting the price, but there is some major resistance present near $ 4 as we have discussed earlier,
If the price tested the resistance level and then breaks the trendline then the price can witness some downfall from higher levels.
TECHNICAL LEVELS :-
RESISTANCE- $ 3.96 AND $ 4.21
SUPPORT – $ 3.65 AND $ 3.31
DISCLAIMER-
The views and opinions stated by the author, or any people named in this article, are for informational purposes only and do not establish financial, investment, or other advice. Investing in or trading crypto assets comes with a risk of financial loss.