- Alba Mineral Resources plc is a London-based mineral exploration and development company.
- It has mining assets in the United Kingdom and Greenland along with Oil investment in the United Kingdom.
- In this article, we will analyze the stock price of ALBA.
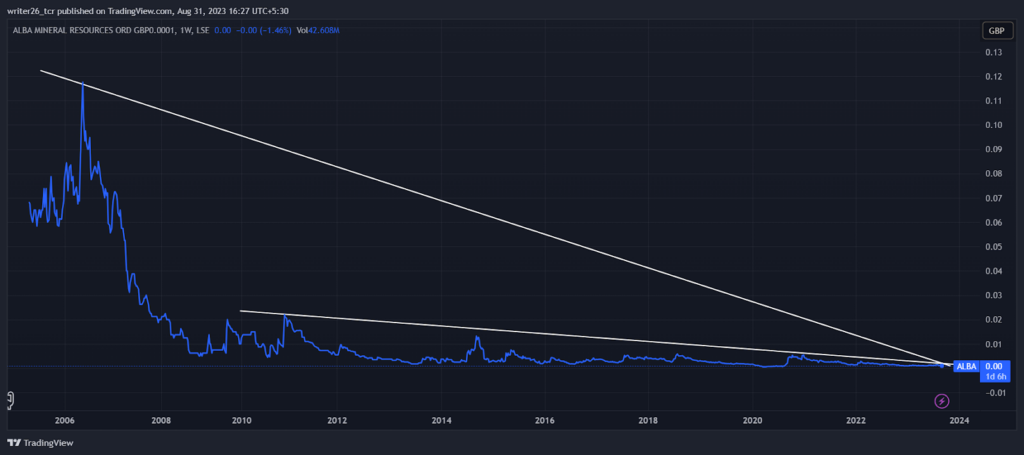
ALBA stock is in a downtrend and it has been falling since it was listed on the London Stock Exchange(LSE). The stock may continue its downtrend because it never showed any recovery signs in the yearly time frame analysis.
However, the ALBA share is good for short sellers or bears present in the market. The stock does not seem good for long-term investment.
Moreover, we will analyze the chart and withdraw some information through technical analysis.
Technical Analysis of ALBA (Yearly)
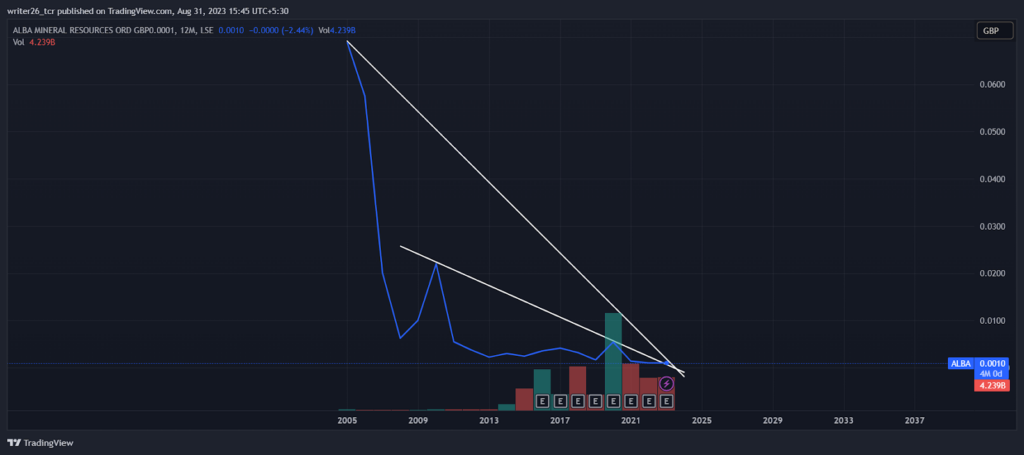
We can observe in the yearly time frame analysis that the stock is in a downtrend. The chart indicates that the stock may fall further by making other lower lows and lower highs. Long-term investment is not quite good for this stock. Investors should invest their money in growing and trending companies.
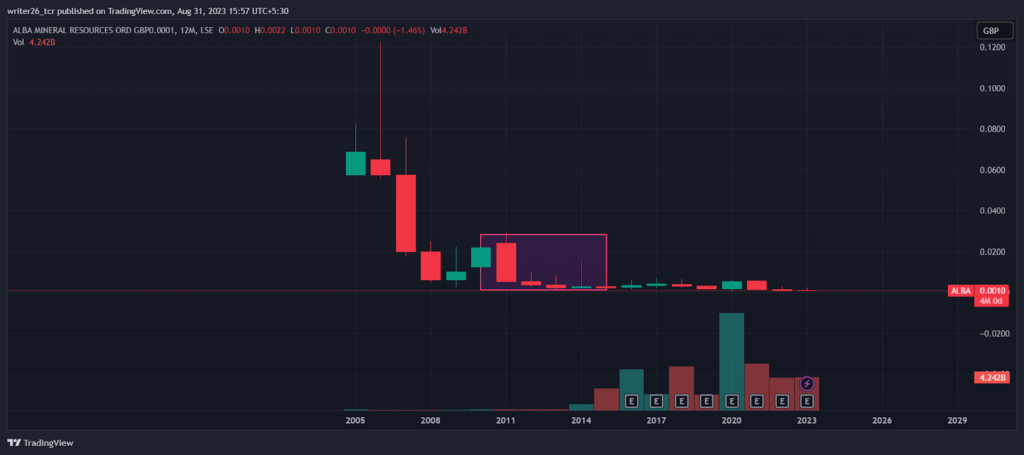
In the chart, we can spot the three black crows, which indicate the continuation of the downtrend. After the formation, the chart continued its downtrend.
The stock is not suitable for long-term purposes. It is better to invest in some other company to gain a good rate of return.
Technical Analysis of ALBA (Monthly)
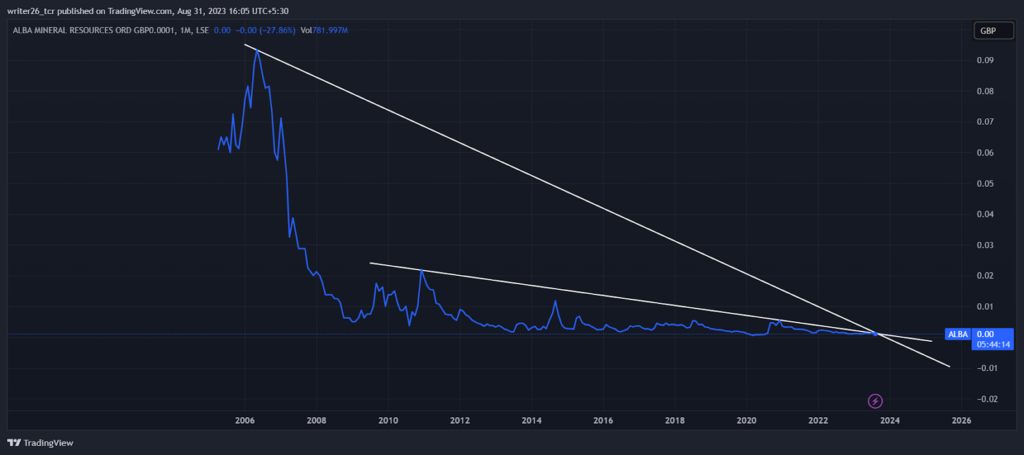
In the monthly time frame analysis, the stock was in a downtrend, but not close to a sideways position. The chances of fall are pretty high because the overall chart is in a downtrend.
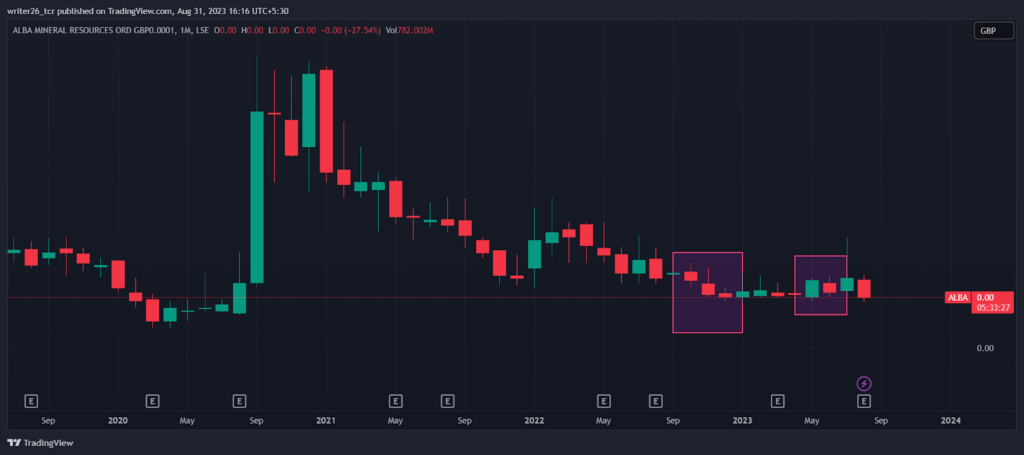
The pattern in the first rectangle is three black crows. It indicates that the stock will continue its downtrend. The pattern in the second rectangle represents bearish harami, indicating the price may fall further.
Technical Analysis of ALBA (Weekly)
In the weekly time frame analysis, the stock was in an uptrend. Near the current market price, it is in a sideways position. So, it is not good for swing traders to invest in this stock.
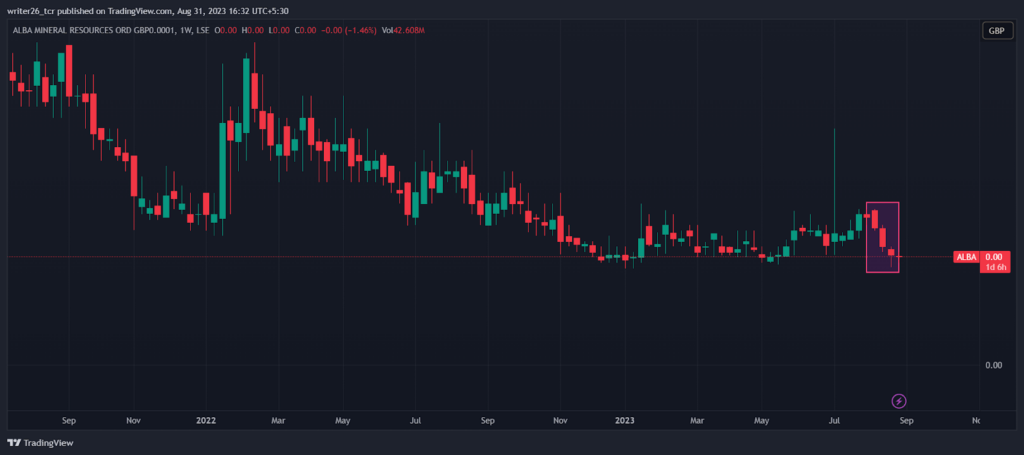
The pattern in the rectangle indicates that the stock is continuing its downtrend. The candle next to it is the confirmation that the stock will continue the downtrend.
Technical Analysis of ALBA(Daily)
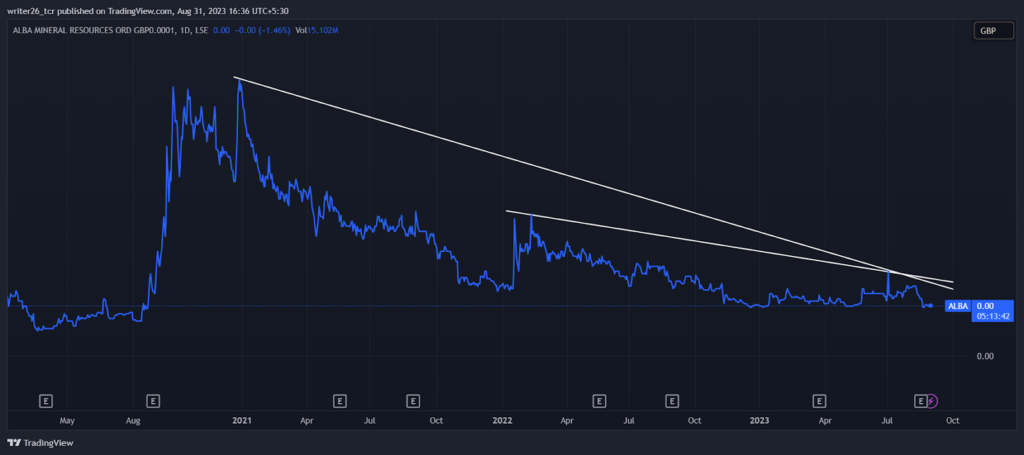
In the daily time frame, the stock was hitting upper and lower circuits many times during trading hours. Investors can’t sell them due to circuit issues.
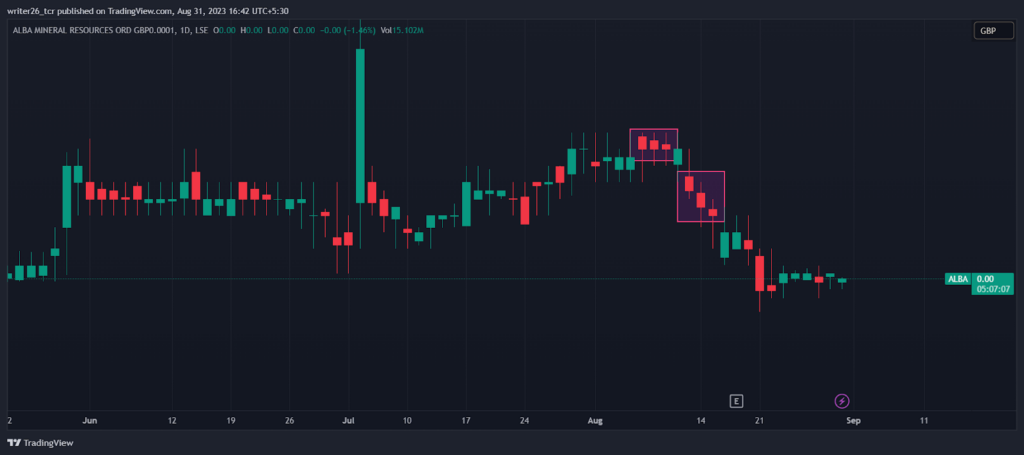
These patterns are giving confirmation time and again that the stock can continue its downtrend. It is not the right choice for long-term investment, but it is a good stock for short sellers.
Conclusion
The stock is in a sideways position in the yearly, monthly, and weekly time frame. So, for positional or swing trading, it is not a very good stock to invest in. However, it is in an uptrend in the daily time frame. It can be a good stock for daily traders.
Levels
Resistance Level- GBX- 0.1305 and GBX- 0.1200(Daily Time Frame)
Support Level- GBX- 0.1050 and GBX- 0.976(Daily Time Frame)
Disclaimer
The analysis is done to provide information through technical analysis and no investment suggestions are given in the article.
