

- The 1INCH coin is consolidating between $0.26 and $0.23 levels.
- This token is trading below the 200-day EMA.
- The $0.38 level will become a crucial zone to continue the downtrend.
After an impulsive bearish move, the 1INCH coin price is consolidating between $0.26 and $0.23 levels. As per the technical analysis, the coin price will try to reach the $0.31 level after ranging between levels.
The 1INCH/USD token is trading below the 200-day EMA. That means the coin price is more likely to continue its respective trend. If the coin price reaches the $0.43 level, we can definitely assume it is initiating an uptrend.
The 1INCH coin is currently trading at $0.25, after dropping from its major supply zone at the $0.38 level. As per technicals, if the price reaches the $0.38 level, it will probably become the next supply zone and will try to continue the downtrend.
The 1INCH Coin Price is Continuously Trading Downtrend
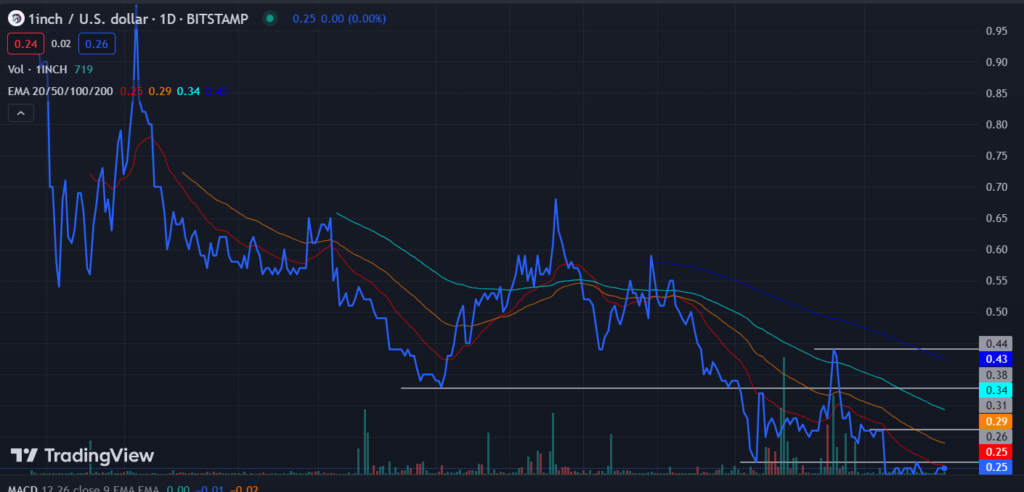
On a daily time frame, the price is going downward. It is currently consolidating between $0.23 to $0.26 levels. The price dropped nearly 66.50% from February 2023 to the current month. Due to that heavy fall, investors are cautious about investing.
The token price is continuously making swing low, as per the chart the last swing low is at the $0.44 level. If the stock price reaches near this level, the seller will likely approach to book some profits.
However, the major supply zone for downtrend continuation is at the $0.38 level. The buyers may try to reach that level after the end of the consolidation.
Technical Analysis Of 1INCH/USD
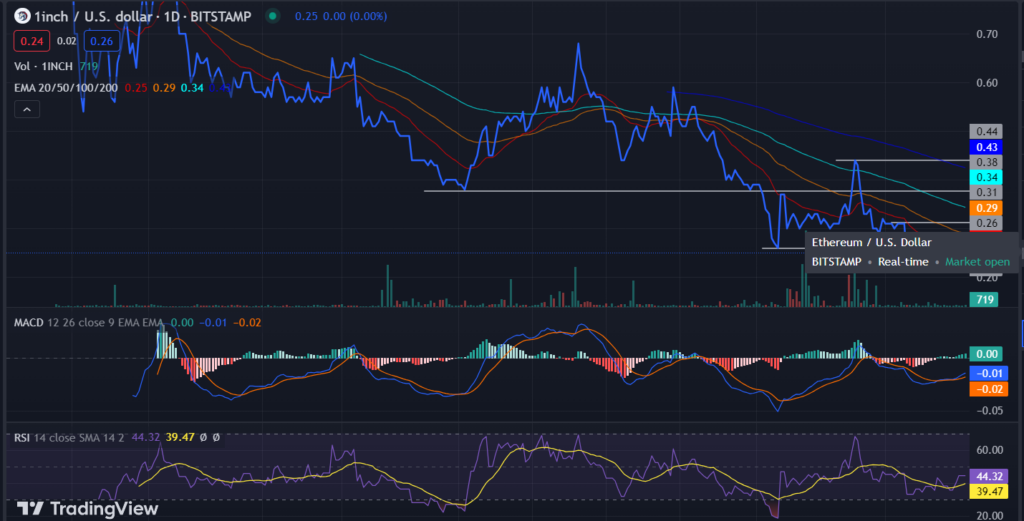
The 1INCH/USD price is trading below 20-day, 50-day, 100-day, and 200-day EMAs are currently averaging at 0.25, 0.29, 0.34, 0.43 levels. Indicating the continuation of the downtrend. As per technicals, the price is expected to drop to the $0.20 level.
The MACD line is averaging above the signal line, the MACD line at -0.01, and the signal line at -0.02, showing low volume near the current zone. It signifies that the buyers and sellers are not interested to buy or sell at this level.
The Relative strength index (RSI) line at 44.32 and the signal line below at 39.47 show that the buyers’ strength is not enough to turn the price upward. For a short period of time, buyers try to swing high. It indicates the price is taking support from previous buyers’ strength zone.
Can 1INCH/USD Reach $0.39 Level
Technical Levels
- Resistance Levels: $0.31 and $0.44
- Support Levels: $0.23 and $0.20
Disclaimer
The views and opinions stated by the author, or any people named in this article is for informational purposes only. They do not establish financial, investment or any other type of advice. Investing in or trading crypto assets comes with a risk of financial loss.