- The LOOM coin’s price has increased by over 454% in a year.
- Loom Network (LOOM) coin’s MACD line has created a bullish crossover.
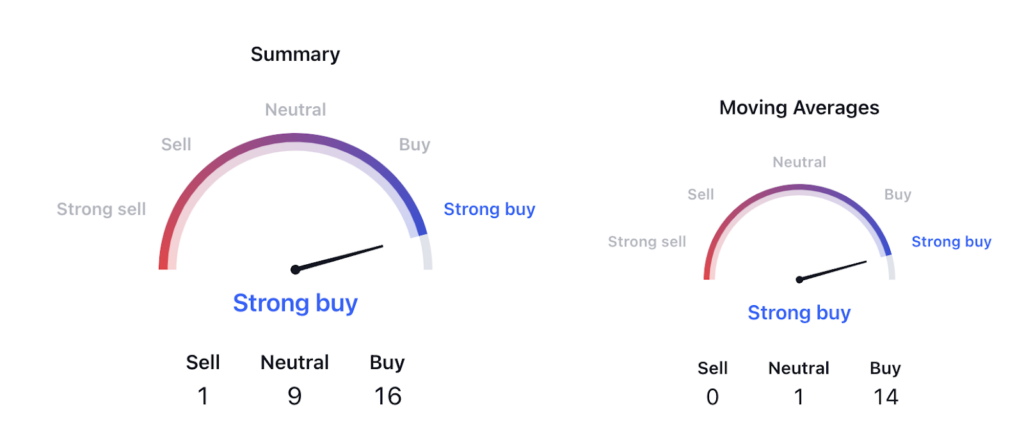
- The technical summary shows a strong buy for the LOOM coin.
Loom Network is a platform-as-a-service (PaaS) solution developed on the Ethereum blockchain. It empowers developers to operate extensive decentralized applications (DApps). This innovative platform was launched on October 1, 2017.
LOOM is currently showcasing an upward trend with the price consistently forming higher highs. It indicates a positive momentum.

An analysis of technical indicators for LOOM provides a strong buy signal. Among the 26 indicators, 16 suggest buying, while only one indicates selling. The moving averages summary also signals a strong buy, reflecting the coin’s robust performance and favoring a potential price increase.
As of now, LOOM is trading at $0.280, marking a 5% increase in today’s market session. The open interest (OI) for LOOM stands at $215 million, with a notable 62% surge in OI during the current session. This surge in OI suggests that new buyers are entering the market, potentially overpowering the sellers.
It’s worth noting that Loom Network (LOOM) achieved an all-time high of $0.77 on May 4, 2018. Following this peak, LOOM experienced a consistent decline, amounting to a drop of over 64%. However, the price found strong support at the $0.03 level, leading to a rebound.
Recent price action indicates a breakout above the $0.75 level, resulting in a 60% surge within a week. This substantial uptick signifies the potential for further price gains in the coming days. Also, the price has given a return of over 454% in just one year.
Furthermore, the increasing volume of LOOM coins, coupled with the formation of significant green candles, suggests a dominant presence of buyers in the market.
Loom Network (LOOM) Coin Price Prediction
LOOM by writer50_tcr on TradingView.com
Technical Indicators Summary
As for the Loom Network coin, its MACD line currently rests above the signal line, coinciding with the emergence of a green histogram. It combination signifies a bullish outlook for LOOM, hinting at the potential for an upcoming price increase.
Furthermore, both the 14-day SMA line and the RSI line of Loom Network (LOOM) are in proximity to the 90 level, situated within the positive zone. The robust RSI line for LOOM indicates a probable price uptick in the future.
Conclusion
As per the analysis, the price of Loom Network is moving upward with a huge surge in price of 453%. The overall sentiment in the coin is positive and the price is making a strong pattern. The indicators are showing a positive signal along with increased Open interest. Hence, considering these factors it can be predicted that the price is likely to rise in the upcoming days.
Technical Levels
- Support Level: $0.17.
- Resistance Level: $0.34.
Disclaimer
The views and opinions of the author, or anyone named in this article, are for informational purposes only. They do not offer financial, investment, or other advice. Investing or trading crypto assets involves the risk of financial loss.
