

BITCOIN is in a correction phase right after the bulls smashed the resistance of $25000 and the price shot up to $30000. After getting resistance, the price saw a pullback back to $25000 and managed a swift recovery of 8.5%
- BTC/USDT is up 0.18% today
- BTC/USDT has formed a downward channel and the price is testing the resistance
BTC/USDT is trading at $26882 after recovery from its recent dip to $25000. This 8.5% bounce has signaled that the bulls are showing strength and won’t let the price fall below $25000. What makes it very strong is that this level is supported by 3 factors. First is the horizontal support along with a trendline support and finally the 200 EMA on the Daly chart.
The Daily chart shows the price is forming a bull flag
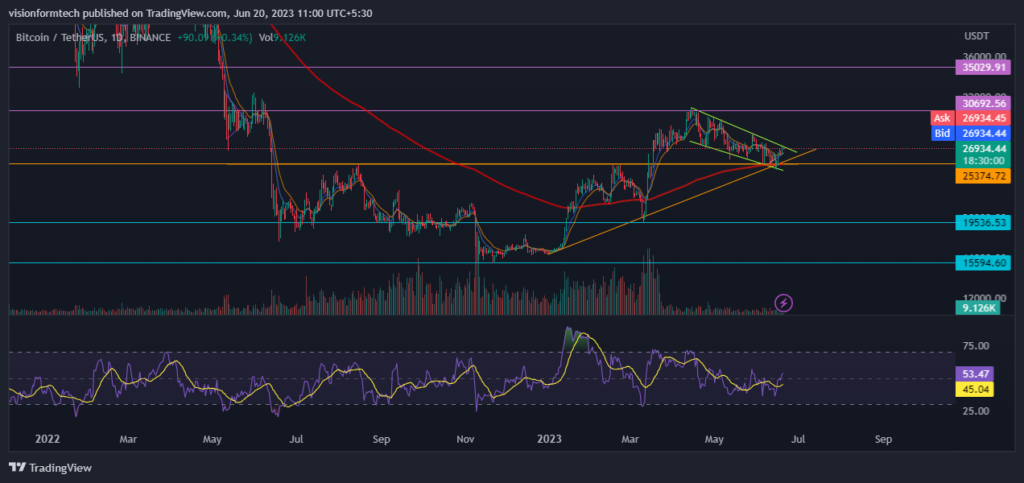
Source: BTC/USDT by TradingView: https://www.tradingview.com/x/J40kYWQo/
The Daily chart is giving an overview of the price action. According to technical analysis, the price formed an inverse head and shoulder pattern over the course of one year. The neckline of this pattern is the Daily support level of $25000. The bulls managed to pierce this resistance and the pattern saw a breakout in the month of March this year. The price skyrocketed to the level of $30000 before it started getting a correction.
Also, the price is being supported by a trendline on the daily timeframe which is acting as a significant support along with the 200 EMA. According to the books, The breakout of this head and shoulders pattern should lead the price to the level of $35000. The price came down forming a parallel channel and the market saw a perfect retest of the neckline at $25000. As the market is bullish, this parallel channel can also be interpreted as a bull flag and the target is also aligning with the head & shoulders pattern, which is $35000. These factors contribute to the probability of further upside in the coming short time.
The 4H chart shows a rejection from the resistance levels.
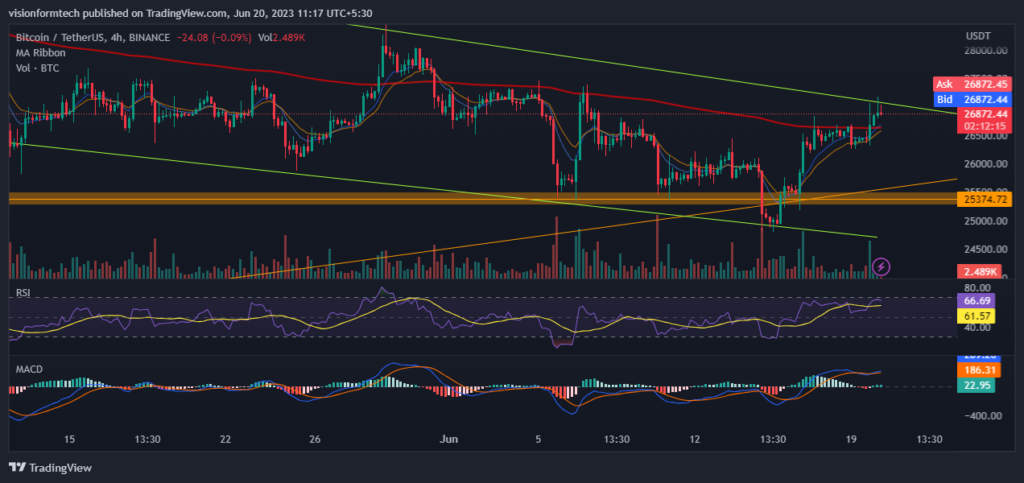
Source: BTC/USDT by TradingView: https://www.tradingview.com/x/KTVP78Dn/
The 4H chart allows us to dig deeper and catch the action in a shorter time frame. The price action is suggesting that BTC will remain bearish to sideways as long as it is trapped in this parallel channel. At present the price seems to be getting a rejection on the upper trendline. The bearish pin bar pattern at the top is suggesting that the bulls are getting weaker and the sellers are becoming active.
It is also important to notice that the price managed to close above the 200 EMA on the 4H time frame. In case of a downfall, the price must first breach the 200, 9, and 15 EMA and then the chances will increase for the price to test the $25300 level which is a 6% fall. The bears have to come in very strong to break the level of $25000. In that case, the market will experience panic selling where the prices can plunge to the level of $19500, which will be a solid drop of 23%.
RSI
The RSI indicator is currently at 64.77 and the RSI has crossed the MA line towards the upside. This is a sign of bullish to sideways market condition.
MACD
The MACD indicator made a bullish crossover, but the histogram is showing that the bulls are losing momentum and a bearish crossover could be on the way
200 EMA
As observed, on the 4hr, the price is trading above the 200 EMA(exponential moving average) which acts as a significant support. This is a clear indication of an uptrend where the buyers are in control and for a trend reversal, the price must break and trade below the 200 EMA.
Technical levels
Support Levels: $25300- Support 1
$24800 – Support 2
Current Price: $26892
Resistance Levels: $27120 – Resistance 1
$30200 – Resistance 2
Conclusion
BTC is getting a correction from its recent rally to the $30000 mark. The price managed to bounce from the daily support zone of $25000. This concludes that the correction has progressed and the price is expected to continue back on its course to $35000 according to the target levels of the head & shoulders pattern. The price is facing a minor resistance at the level of $27000. Although the market is bullish, investors must closely watch the level of $25000. As long as the price remains above it, the market will remain bullish. A breach of this level can signal that a bear market is on its way.