

- FIL price is up by 0.98% in a week, (-14.45%) in a month and (-44.66%) in a year.
- FIL price has jumped over 11% from its recent lows i.e. $2.956.
- FIL price has declined over 99% from its all-time high i.e. $430.
Market capital of Filecoin – $2.939 million
The current market price of Filecoin- $3.299
The Filecoin (FIL) price is trading at $3.299, up by 2.01% in the current session on 15 September. The cost of this coin is rising by a fourth consecutive session from the crucial support zone, indicating that the buyers are still present at the demand zone. The price is facing a slight rejection around the previous swing high of $3.310.
The Filecoin price has declined by over 99% from its all-time high of $430, which it created on its listing day. After March 2021 the price surged by over 600%, from $32 to $238 which gave some joyful moments to the investors. After that, the price has continuously fallen and is now trading at $3.299 which means the price is now in a strong bearish grip.
Price is currently taking support from the range near the low of a huge bearish candle the price made on 16 December 2022. Since then the price has never breached the low of that candle which indicates that the buyers are very bullish at this level.
Technical analysis of Filecoin (FIL)
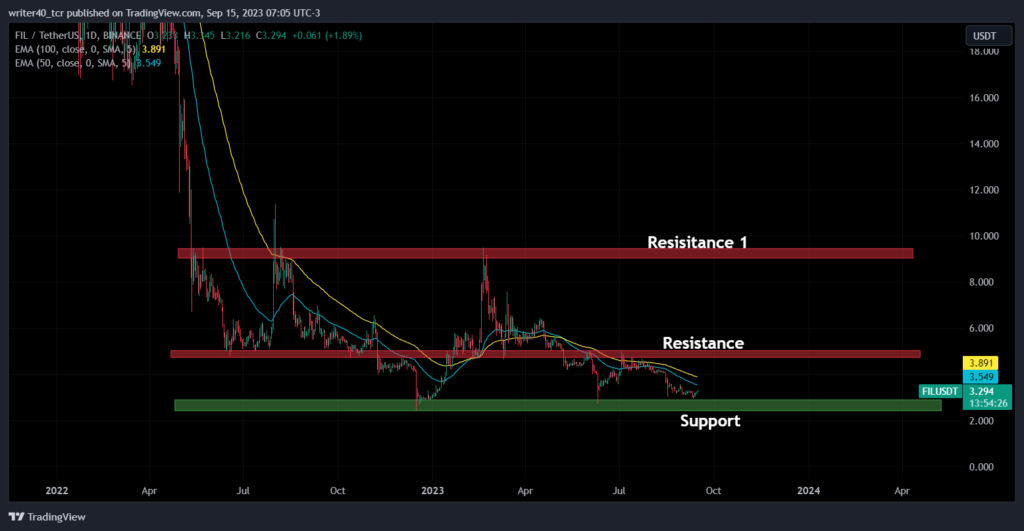
FIL price is trading below the important EMAs level of 50 and 100. The EMAS are currently placed at $3.549 and $3.891 which is very close to the price. The price has shown some jump from the support level of $3.043 and $2.95. The EMAs will act as a resistance for the price on the higher levels.
The resistance level is placed at $3.513 and $3.613 i.e the previous swing high of the current trend. The next resistance is visible near the $9.14 and $9.45 which is a very crucial level. The price is forming a double bottom pattern and if it succeeds to cross this level then we can witness some good upside from here.
Technical levels on 1 hour chart :
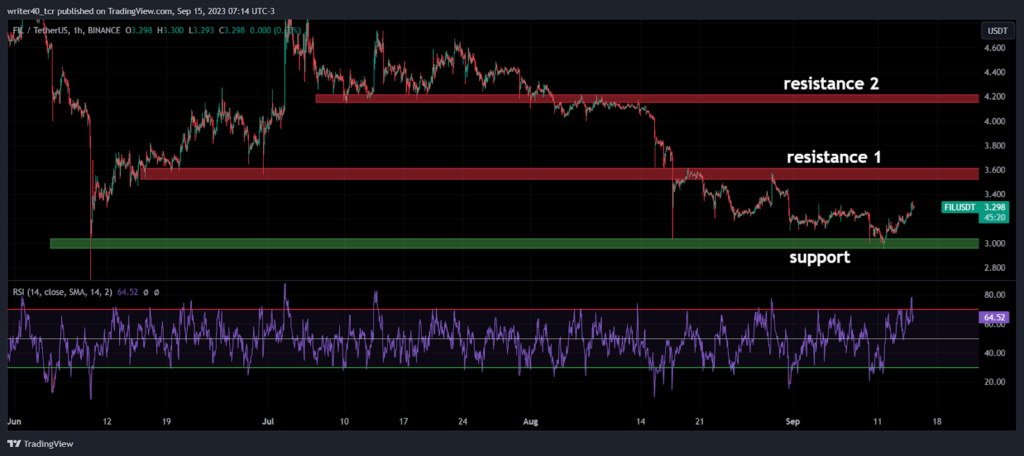
The price is currently trying to break some small hurdles and preparing for a strong breakout from a major resistance level. The price is looking strong at current time and is heading towards the resistance level 1 of $3.50 and $3.60. The next resistance is present near the $4.20 level which is the most important resistance for the buyers to cross.
If we talk about RSI, it is standing strong at 64.52 levels which means on hourly time frame the buyers are dominating the market. Although the RSI went up in an over-bought trajectory and is now cooling down at present level.
Conclusion
As we have discussed that the price is showing some strength at lower levels and forming a double bottom kind of pattern. If the price is able to sustain this pattern and try to go up, it can show some good upside towards the level $4.200. In the hourly time frame the price is trying to change the downward structure. Once the price breaches the $3.60 levels it can generate some more momentum on upside
Technical levels
- Resistance- $3.6 and $4.2
- Support- $2.94 and $2.46
Disclaimer
The analysis is done for providing information through technical analysis and no investment suggestions are given in the article to be made by investors. The coins are unpredictable so investors should have proper knowledge. Cryptocurrencies are highly volatile and risky. Investment should be made with proper technical analysis.